Corrplot
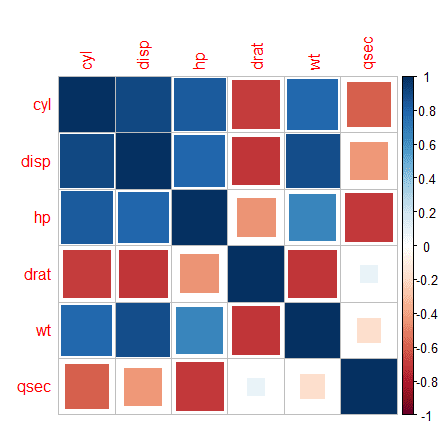
Corrplot is a graphical display for correlation matrix and confidence intervals. We can change the shape, layout, ordering, colour labels etc. using this powerful function.
For corrplot, to work you need to install the corrplot package. The input to this function will be a correlation matrix.
R Code - Visualization
> #Generating the correlation matrix
> correlation <- cor(mtcars[2:7])
> correlation
            cyl       disp         hp        drat         wt        qsec
cyl   1.0000000  0.9020329  0.8324475 -0.69993811  0.7824958 -0.59124207
disp  0.9020329  1.0000000  0.7909486 -0.71021393  0.8879799 -0.43369788
hp    0.8324475  0.7909486  1.0000000 -0.44875912  0.6587479 -0.70822339
drat -0.6999381 -0.7102139 -0.4487591  1.00000000 -0.7124406  0.09120476
wt    0.7824958  0.8879799  0.6587479 -0.71244065  1.0000000 -0.17471588
qsec -0.5912421 -0.4336979 -0.7082234  0.09120476 -0.1747159  1.00000000
>
> #Generating the plot
> corrplot(correlation)
> corrplot(correlation, method = "square")
> # Layout selection
> corrplot(correlation, type = "lower")


No comments:
Post a Comment